Nearly 1 in 3 California hospitals is at risk of closing or cutting services because of HR1’s Medicaid cuts — in a state where nearly 7 million residents already live in a federally designated primary care shortage area. When a hospital closes, its patients may have to travel far for care, and the remaining hospitals must absorb the additional volume in inpatient beds and especially in their emergency departments. Hospitals at risk of closing can be clustered in dense urban areas like Los Angeles County, where there are 22, while others are the only facility serving a large rural region. Calaveras, Glenn, Lassen, and Yuba counties each have just one hospital, and in every case that hospital is at risk of closing.
Moreover, up to 3.4 million Californians are projected to lose Medi-Cal coverage and another 660,000 marketplace enrollees are expected to become uninsured under HR1.1 Most of them will become uninsured, losing access to preventive and timely care and turning instead to emergency rooms, which cannot turn them away.
Not every hospital has an emergency department (ED), however. Over 100 of the 415 general acute care hospitals in California do not operate an emergency department.2 Nearly all of the hospitals at risk of closing operate an emergency department: 80 of the 83 at-risk hospitals, or 96 percent. 3
Maternity care, particularly labor and delivery, is also one of the first service lines to be cut under financial stress. California has already lost 50+ labor and delivery units since 2014 – a 21 percent drop in hospitals offering maternity services.4 Hospital closures and service cuts will only exacerbate the shortage. Currently, all of the at-risk hospitals in California provide labor and delivery services, while only 39 percent of the states’ non-at-risk hospitals do.5
Emergency department closures also carry particular risk for stroke and heart attack patients, whose outcomes depend directly on how far they must travel. Removing a hospital lengthens that routing and delays treatment, and the evidence indicates the delay itself is what creates fatality. The same is true for stroke care, which operates on an even tighter window. The consequences extend beyond the closure's immediate service area, since consolidation crowds the hospitals that remain.
ACCESS TO ALTERNATIVE HOSPITALS, EMERGENCY DEPARTMENTS, AND MATERNITY CARE
Within a 30-Mile Radius
California law requires Medi-Cal managed care plans to include in their provider networks at least one hospital within 15 miles or 30 minutes of a member’s residence (Welf. & Inst. Code §14197). Among the 83 at-risk hospitals, more than a quarter of them (22) have fewer than five non-at-risk hospitals within 30 miles of driving distance, and ten have none at all.6 Proximity alone understates the problem, however, because a surviving hospital may not offer essential services like emergency or labor and delivery. The four at-risk hospitals in Humboldt and Kern counties have exactly one non-at-risk hospital within 30 driving miles, and that hospital has neither an emergency department nor labor and delivery services.
| Table 1. Accessibility of Alternative Hospitals, Emergency Departments, and Labor & Delivery Services | ||||
|---|---|---|---|---|
| # of Non-At-Risk Hospitals Within 30 Miles Driving | ||||
| At-Risk Hospital | County | Total | With Emergency Department | With Labor & Delivery |
| Coalinga Regional Medical Center | Fresno | 0 | 0 | 0 |
| Glenn Medical Center | Glenn | 0 | 0 | 0 |
| El Centro Regional Medical Center | Imperial | 0 | 0 | 0 |
| Pioneers Memorial Hospital | Imperial | 0 | 0 | 0 |
| Northern Inyo Hospital | Inyo | 0 | 0 | 0 |
| Southern Inyo Hospital | Inyo | 0 | 0 | 0 |
| Ridgecrest Regional Hospital | Kern | 0 | 0 | 0 |
| Banner Lassen Medical Center | Lassen | 0 | 0 | 0 |
| Adventist Health Mendocino Coast | Mendocino | 0 | 0 | 0 |
| Sierra View Medical Center | Tulare | 0 | 0 | 0 |
| Mad River Community Hospital | Humboldt | 1 | 0 | 0 |
| Providence Redwood Memorial Hospital | Humboldt | 1 | 0 | 0 |
| Providence St. Joseph Hospital | Humboldt | 1 | 0 | 0 |
| Adventist Health Delano | Kern | 1 | 0 | 0 |
| Palmdale Regional Medical Center | Los Angeles | 1 | 1 | 1 |
| Adventist Health Tulare | Tulare | 1 | 1 | 1 |
| Shasta Regional Medical Center | Shasta | 3 | 1 | 1 |
| Orchard Hospital | Butte | 3 | 2 | 1 |
| Adventist Health And Rideout | Yuba | 3 | 2 | 1 |
| Mark Twain Medical Center | Calaveras | 3 | 2 | 2 |
| Kaweah Health Medical Center | Tulare | 3 | 2 | 2 |
| Healdsburg Hospital | Sonoma | 4 | 2 | 2 |
| Providence Queen Of The Valley Medical Center | Napa | 4 | 4 | 2 |
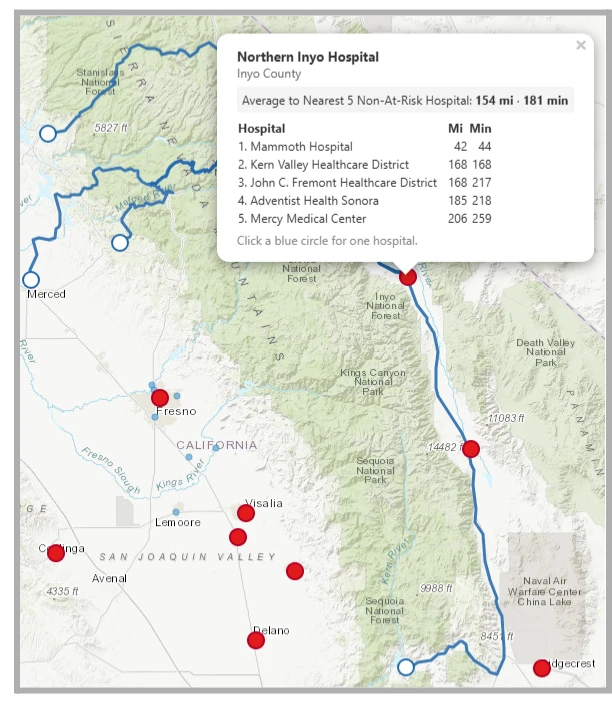
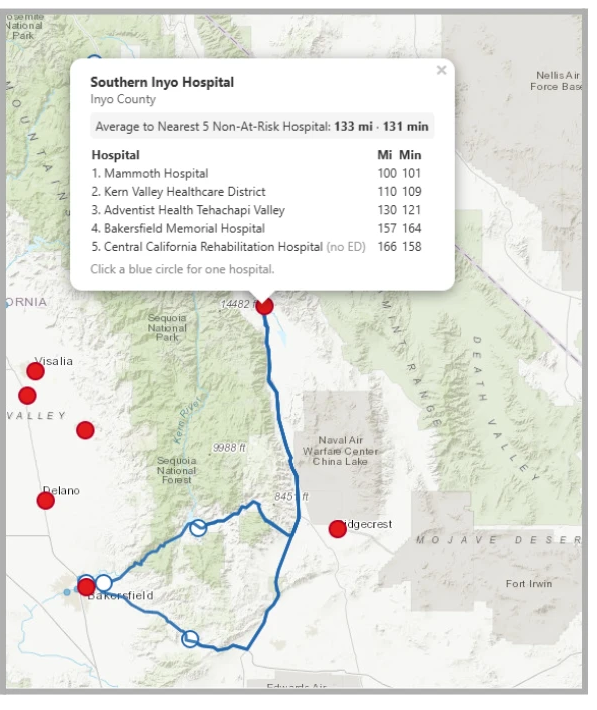
When a hospital closes, the distance to the next facility that is not itself at risk can be substantial. At Northern Inyo Hospital, the five nearest non-at-risk hospitals are an average of 153.7 miles, or just over three hours, away. At Southern Inyo Hospital, the closest non-at-risk hospital — Mammoth Hospital in Mono County — is 99.6 miles and 101 minutes of driving away.
Table 2. Distance to 5 Nearest Non-At-Risk Hospitals from At-Risk Hospitals(Average Driving Distance > 30 Miles) |
|||||
|---|---|---|---|---|---|
| Driving Distance | |||||
| Miles | Minutes | ||||
| At-Risk Hospital | County | Average | Minimum | Maximum | Average |
| Northern Inyo Hospital | Inyo | 151.8 | 41.7 | 187.3 | 174.4 |
| Southern Inyo Hospital | Inyo | 127.6 | 99.6 | 155.6 | 124.2 |
| El Centro Regional Medical Center | Imperial | 98.5 | 86.7 | 104.1 | 102.4 |
| Pioneers Memorial Hospital | Imperial | 86.8 | 73.6 | 95.0 | 96.8 |
| Providence Redwood Memorial Hospital | Humboldt | 83.8 | 20.4 | 122.6 | 96.0 |
| Providence St. Joseph Hospital | Humboldt | 79.6 | 0.4 | 139.7 | 89.6 |
| Mad River Community Hospital | Humboldt | 79.5 | 11.6 | 136.8 | 92.6 |
| Banner Lassen Medical Center | Lassen | 77.5 | 37.6 | 104.3 | 89.6 |
| Ridgecrest Regional Hospital | Kern | 77.2 | 53.9 | 88.6 | 82.6 |
| Adventist Health Mendocino Coast | Mendocino | 67.2 | 35.5 | 102.0 | 93.4 |
| Coalinga Regional Medical Center | Fresno | 59.4 | 45.0 | 66.8 | 67.8 |
| Sierra View Medical Center | Tulare | 50.2 | 48.2 | 51.4 | 57.4 |
| Adventist Health Tulare | Tulare | 37.2 | 24.8 | 52.0 | 40.8 |
| Glenn Medical Center | Glenn | 36.1 | 32.4 | 43.3 | 43.6 |
| Palmdale Regional Medical Center | Los Angeles | 36.0 | 9.1 | 47.2 | 39.0 |
| Kaweah Health Medical Center | Tulare | 34.1 | 21.7 | 48.9 | 35.4 |
| Mark Twain Medical Center | Calaveras | 32.2 | 16.7 | 43.9 | 45.8 |
| Adventist Health Delano | Kern | 31.7 | 29.3 | 33.8 | 34.4 |
Maps of Northern and Southern Inyo Hospitals – Driving Routes and Distance to Nearest 5 Non-At-Risk Hospitals. To access the interactive map for all hospitals, open this html file in your web browser.
ER CROWDING
Many California emergency departments are already at or beyond capacity.7 The 80 at-risk hospitals that operate emergency departments recorded nearly 3.3 million ED visits in 2024. If all of them closed, the remaining non-at-risk hospitals would have to absorb that volume on top of their own 12.2 million visits — an increase of 27 percent – leading to longer wait times for inpatient beds and in the ERs.8
The 5 Nearest Emergency Departments
Nearly a third of non-at-risk hospitals9 have no emergency department of their own, so a closure does not simply redistribute emergency patients to the next hospital down the road; in many places there is no ED to redistribute them to. Patients at two of the three at-risk hospitals in Humboldt County, for example, would have to travel more than 100 miles, or over two hours, to reach an emergency department if Mad River Community Hospital and Providence Redwood Memorial Hospital were to close.
Table 3. Distance to 5 Nearest Non-At-Risk Emergency Departments from At-Risk Hospitals(Average Driving Distance > 30 Miles) |
|||||
|---|---|---|---|---|---|
| Driving Distance | |||||
| Miles | Minutes | ||||
| At-Risk Hospital | County | Average | Minimum | Maximum | Average |
| Northern Inyo Hospital | Inyo | 151.8 | 41.7 | 187.3 | 174.4 |
| Southern Inyo Hospital | Inyo | 127.6 | 99.6 | 155.6 | 124.2 |
| Providence St. Joseph Hospital | Humboldt | 109.1 | 67.6 | 147.9 | 124.6 |
| Mad River Community Hospital | Humboldt | 107.6 | 76.1 | 150.2 | 122.2 |
| Providence Redwood Memorial Hospital | Humboldt | 106.3 | 49.6 | 132.8 | 129.8 |
| El Centro Regional Medical Center | Imperial | 100.0 | 86.7 | 107.7 | 103.4 |
| Pioneers Memorial Hospital | Imperial | 91.9 | 73.6 | 113.5 | 99.8 |
| Banner Lassen Medical Center | Lassen | 77.5 | 37.6 | 104.3 | 89.6 |
| Ridgecrest Regional Hospital | Kern | 77.2 | 53.9 | 88.6 | 82.6 |
| Adventist Health Mendocino Coast | Mendocino | 67.2 | 35.5 | 102.0 | 93.4 |
| Coalinga Regional Medical Center | Fresno | 61.3 | 45.0 | 72.0 | 68.6 |
| Sierra View Medical Center | Tulare | 53.2 | 50.6 | 58.5 | 61.6 |
| Glenn Medical Center | Glenn | 44.4 | 32.4 | 67.7 | 48.2 |
| Adventist Health Delano | Kern | 44.3 | 32.2 | 64.2 | 47.2 |
| Adventist Health Tulare | Tulare | 42.7 | 24.8 | 57.2 | 45.6 |
| Shasta Regional Medical Center | Shasta | 42.7 | 1.6 | 70.9 | 48.0 |
| Kaweah Health Medical Center | Tulare | 39.6 | 21.7 | 54.1 | 40.0 |
| Mark Twain Medical Center | Calaveras | 36.9 | 16.7 | 49.0 | 50.2 |
| Orchard Hospital | Butte | 36.1 | 17.2 | 55.6 | 44.8 |
| Palmdale Regional Medical Center | Los Angeles | 36.0 | 9.1 | 47.2 | 39.0 |
| Adventist Health And Rideout | Yuba | 32.3 | 25.4 | 36.8 | 41.4 |
Medicaid Unwinding, Marketplace Premium Increases
Medicaid work requirements and marketplace premium increases will leave around 3 million Californians uninsured, pushing additional patients into hospitals’ emergency departments.10 Uninsured patients rely on the emergency room for care, because preventive and otherwise timely treatment is inaccessible without insurance. Moreover, nearly 7 million Californians live in a federally designated primary care shortage area, where HRSA estimates that just over half of primary care need is met. Where appointments are scarce, the emergency department becomes the default point of entry. Coverage loss therefore does not simply mean forgone care; it redirects care to the ED.11 The pattern is well documented in reverse: multiple studies have found that ED visits fell in Medicaid expansion states, particularly for non-emergency and preventable conditions.12 Emergency departments absorb that demand by law as well as by default. Under the federal Emergency Medical Treatment and Labor Act, any hospital with an emergency department must screen and stabilize every patient who arrives, regardless of insurance status or ability to pay. Rising uninsured volume therefore lands on emergency departments as uncompensated care.13
California’s recent experience offers a preview. Beginning April 1, 2023, states were required to resume Medicaid eligibility determinations, “unwinding” the continuous enrollment provisions of the COVID-19 public health emergency. California’s unwinding began in July 2023 and ultimately disenrolled nearly 2 million people, a 13 percent reduction in Medi-Cal enrollment. A Health Affairs Scholar study found that the uninsured share of California ED visits rose by roughly 10.2 percent relative to the two quarters preceding the unwinding, with the largest increases at rural hospitals, small hospitals, and hospitals in high-poverty counties.14
Below is a county-based estimate of how much ED encounters – visits that are treated or turned into admissions – could increase at non-at-risk hospitals if at-risk hospitals were to close and their ED encounters were shifted to non-at-risk hospitals in the same county. In seven counties, there are no other non-at-risk hospitals in the county and patients in those counties would be stranded, or without access to an emergency department. These estimates do not take into consideration the additional ED visits by uninsured patients from loss of Medi-Cal or marketplace insurance coverage.
| Table 4. County-Level Analysis of Medi-Cal Coverage Loss and Potential ED Overcrowding | ||||||
|---|---|---|---|---|---|---|
| County | Estimated Medi-Cal Coverage Loss15 | At-Risk Hospitals | Non-At-Risk Hospitals | ED Encounters at At-Risk Hospitals | ED Encounters at Non-At-Risk Hospitals | Increase if Absorbed |
| Tulare | 19,000 | 3 | 0 | 162,464 | - | Stranded |
| Imperial | 2,000 | 2 | 0 | 81,464 | - | |
| Yuba | 2,000 | 1 | 0 | 72,177 | - | |
| Lassen | 1,000 | 1 | 0 | 11,484 | - | |
| Calaveras | 2,000 | 1 | 0 | 11,401 | - | |
| Inyo | 1,000 | 2 | 0 | 11,390 | - | |
| Glenn | 1,000 | 1 | 0 | 6,106 | - | |
| Humboldt | 10,000 | 3 | 2 | 60,028 | 3,551 | 1690% |
| Napa | 8,000 | 1 | 1 | 32,600 | 7,288 | 447% |
| San Francisco | 65,000 | 5 | 8 | 159,413 | 113,177 | 141% |
| Sonoma | 33,000 | 3 | 5 | 77,066 | 119,562 | 64% |
| Santa Cruz | 19,000 | 1 | 2 | 34,038 | 52,820 | 64% |
| Ventura | 61,000 | 2 | 8 | 116,768 | 196,580 | 59% |
| Shasta | 9,000 | 1 | 4 | 29,507 | 61,028 | 48% |
| Kern | 29,000 | 3 | 10 | 118,700 | 264,797 | 45% |
| Los Angeles | 1,113,000 | 23 | 67 | 1,010,918 | 2,691,726 | 38% |
| Fresno | 27,000 | 2 | 8 | 99,967 | 292,383 | 34% |
| Sacramento | 111,000 | 2 | 10 | 153,686 | 516,501 | 30% |
| San Diego | 210,000 | 3 | 21 | 273,265 | 932,024 | 29% |
| Orange | 249,000 | 9 | 26 | 235,589 | 830,544 | 28% |
| San Joaquin | 18,000 | 2 | 6 | 89,437 | 345,970 | 26% |
| Mendocino | 9,000 | 1 | 2 | 11,391 | 48,088 | 24% |
| Solano | 30,000 | 1 | 4 | 32,362 | 189,273 | 17% |
| Contra Costa | 73,000 | 1 | 8 | 55,124 | 351,418 | 16% |
| Santa Clara | 129,000 | 1 | 13 | 78,873 | 601,533 | 13% |
| Riverside | 189,000 | 3 | 18 | 115,231 | 879,630 | 13% |
| Butte | 14,000 | 1 | 4 | 10,914 | 100,621 | 11% |
| Alameda | 127,000 | 2 | 16 | 62,845 | 595,523 | 11% |
| San Bernardino | 177,000 | 1 | 24 | 77,536 | 911,165 | 9% |
| Statewide | 2,980,000 | 83 | 332 | 3,291,744 | 12,178,832 | 27% |
Hospital Closures Impact to Stroke and Cardiology Services
Critical delays in time-sensitive services
ER closures will also have a major impact on stroke and heart attack patients. Because stroke and cardiology services are time-critical, distance has a direct impact on outcomes. Unlike most hospital care, acute stroke and STEMI (ST-elevation myocardial infarction), which is a very severe and life-threatening type of heart attack, run on tiered systems built by county Local EMS Agencies (LEMSAs). Ambulances bypass the nearest ED to reach a designated STEMI Receiving Center or stroke receiving center. That design assumes a certain density of designated facilities.16 Removing a hospital then lengthens the routing for the necessary treatment, critically delaying treatment for the patient.
A national study of Medicare AMI patients (2001–2011)17 found that in communities where an ED closure increased driving time by 30+ minutes, patients saw roughly a 30% relative increase in 90-day mortality and about a 21% relative 1-year mortality. Additionally, adverse effects appeared at increases as small as 10 minutes. The authors concluded the dominant mechanism was time delay itself — infarcts get bigger while the patient is in the ambulance — not the unavailability of treatment somewhere. For stroke services, the same is true with a tighter window. A 2025 study reported that nationally, about 20% of US adults (about 49 million) already live more than 60 minutes from an endovascular-capable center, and every 10-minute delay to revascularization costs roughly 40 disability-free days of life.18
When hospitals close, although these services are not eliminated, they are consolidated. Impact will affect not only those who live near hospital closures and need the services, but also individuals who live near the open hospitals that may need other services because hospitals will be more crowded. Examining California emergency department closures between 1999 and 2010, one study found that patients admitted to hospitals near a closure faced 5 percent higher odds of inpatient death than patients at unaffected hospitals.19 The effect was concentrated in exactly the conditions where minutes matter: 15 percent higher odds for heart attack, 10 percent for stroke, and 8 percent for sepsis. Patients admitted for asthma or chronic obstructive pulmonary disease (COPD) — the least time-sensitive condition examined — showed no increase at all.
MATERNITY CARE
Medicaid cuts and hospital closures will be detrimental to maternity care services in California. In 2023, Medi-Cal covered 41% of California's roughly 400,000 births (private insurance, 53%)20 and since 2014, the state has already lost 50+ labor and delivery (L&D) units — a 21% drop in hospitals offering maternity services.
A March of Dimes' 2026 report has 8.6% of CA counties as maternity care deserts, 17.2% with no birthing facility at all, and 45.5% of rural counties with none; 78,000 women of reproductive age live more than 30 minutes from a hospital with L&D and eight counties have no OB-GYN.21
Clinical literature is consistent that women get less adequate prenatal and postpartum care when it is not local, with higher complication and mortality risk for mother and baby.22 Further hospital closures will only exacerbate these conditions and health outcomes for this vulnerable population that require access to maternity care.
The 5 Nearest Labor & Delivery Services
Table 5. Distance to 5 Nearest Non-At-Risk Labor & Delivery Services from At-Risk Hospitals(Average Driving Distance > 30 Miles) |
|||||
|---|---|---|---|---|---|
| Driving Distance | |||||
| Miles | Minutes | ||||
| At-Risk Hospital | County | Average | Minimum | Maximum | Average |
| Northern Inyo Hospital | Inyo | 199.3 | 177.1 | 214.6 | 233.6 |
| Southern Inyo Hospital | Inyo | 156.7 | 142.3 | 167.2 | 155.2 |
| Mad River Community Hospital | Humboldt | 148.1 | 76.1 | 185.3 | 165.4 |
| Providence St. Joseph Hospital | Humboldt | 145.6 | 86.4 | 174.8 | 168.0 |
| Providence Redwood Memorial Hospital | Humboldt | 135.2 | 104.9 | 156.8 | 164.4 |
| Banner Lassen Medical Center | Lassen | 115.2 | 104.3 | 124.9 | 129.8 |
| El Centro Regional Medical Center | Imperial | 101.1 | 86.7 | 110.3 | 105.2 |
| Pioneers Memorial Hospital | Imperial | 98.3 | 73.6 | 122.8 | 103.2 |
| Adventist Health Mendocino Coast | Mendocino | 91.7 | 56.6 | 114.1 | 112.8 |
| Ridgecrest Regional Hospital | Kern | 89.7 | 84.0 | 100.5 | 99.4 |
| Coalinga Regional Medical Center | Fresno | 64.7 | 45.0 | 76.3 | 71.4 |
| Sierra View Medical Center | Tulare | 54.0 | 50.6 | 58.5 | 62.6 |
| Shasta Regional Medical Center | Shasta | 52.6 | 1.6 | 94.0 | 57.0 |
| Glenn Medical Center | Glenn | 51.6 | 33.5 | 68.8 | 55.4 |
| Adventist Health Delano | Kern | 45.1 | 32.4 | 64.2 | 48.2 |
| Adventist Health Tulare | Tulare | 42.7 | 24.8 | 57.2 | 45.6 |
| Orchard Hospital | Butte | 41.5 | 17.2 | 56.1 | 51.2 |
| Kaweah Health Medical Center | Tulare | 39.6 | 21.7 | 54.1 | 40.0 |
| Mark Twain Medical Center | Calaveras | 37.7 | 16.7 | 50.0 | 51.8 |
| Adventist Health Bakersfield | Kern | 36.6 | 1.5 | 87.4 | 38.6 |
| Palmdale Regional Medical Center | Los Angeles | 36.5 | 9.1 | 48.0 | 40.0 |
| Healdsburg Hospital | Sonoma | 36.3 | 12.8 | 54.5 | 45.8 |
| Adventist Health And Rideout | Yuba | 36.0 | 28.2 | 43.5 | 43.0 |
California Health & Human Services Agency, “H.R. 1 Impact” presentation, July 19, 2025. https://www.chhs.ca.gov/wp-content/uploads/2025/07/CalHHS-Merged-HR1-Slides-7.19.25.pdf↩︎
HCAI 2024 Hospital Emergency Department - Characteristics by Facility (Pivot Profile), see https://data.chhs.ca.gov/dataset/hospital-emergency-department-characteristics-by-facility-pivot-profile↩︎
HCAI 2024 Hospital Emergency Department - Characteristics by Facility (Pivot Profile), see https://data.chhs.ca.gov/dataset/hospital-emergency-department-characteristics-by-facility-pivot-profile↩︎
https://www.marchofdimes.org/peristats/assets/s3/reports/mcd/Maternity-Care-Report-California.pdf↩︎
HCAI 2024 Hospital Annual Utilization Report, see https://data.chhs.ca.gov/dataset/hospital-annual-utilization-report↩︎
As a conservative measure of access, we count the number of hospitals within 30 miles of driving distance from each at-risk hospital, using Google Maps API. We rely on distance rather than time because driving times can vary with congestion and time of day, and that variation is itself uneven across geographies: a trip that takes 30 minutes at midday in Los Angeles can take far longer at rush hour, while rural travel times are comparatively stable throughout the week.↩︎
EMSA February 2026 report to the Commission on EMS states that 55 percent of California hospitals exceeded their local ambulance patient offload time (APOT) standard in January 2026. APOT is the interval between ambulance arriving at an emergency department and the moment the ED formally takes over the patient. The statewide ceiling is 30 minutes 90 percent of the time. Offload delay happens when an ED has reached capacity and can’t take the patient so APOT is a capacity measure.↩︎
Authors' calculation from HCAI 2024 emergency department utilization data. Displaced volume (3,291,744 visits at the 80 at-risk hospitals with EDs) divided by 2024 ED volume at non-at-risk hospitals (12,178,832), yielding a 27.0 percent increase in aggregate. This is a pooled ratio, not the mean of hospital-level increases, and it assumes closure of all 80 facilities with all displaced visits absorbed elsewhere.↩︎
Analysis includes all general acute care hospitals as defined by California Department of Public Health (CDPH). CDPH includes specialty, psychiatric, and long-term acute care hospitals in their definition. See https://data.ca.gov/dataset/licensed-and-certified-healthcare-facility-crosswalk↩︎
Up to 3.4 million Californians are projected to lose Medi-Cal coverage under HR1, and the Congressional Budget Office (CBO) estimated that 92 percent of those who lose Medicaid under the law’s work requirement will become uninsured. Congressional Budget Office, letter to the Hon. Ron Wyden, the Hon. Frank Pallone, Jr., and the Hon. Richard E. Neal, June 4, 2025. https://www.cbo.gov/system/files/2025-06/Wyden-Pallone-Neal_Letter_6-4-25.pdf↩︎
US Department of Health & Human Services, Health Resources and Services Administration, Bureau of Health Workforce, “Designated HPSA Quarterly Summary,” data as of December 31, 2025, https://data.hrsa.gov/topics/health-workforce/shortage-areas↩︎
https://jamanetwork.com/journals/jamanetworkopen/fullarticle/2793351↩︎
Health Affairs Scholars 2026↩︎
Nima Khodakarami, Theodoros V Giannouchos, Daniel Marthey, Benjamin Ukert, Joel Segel, Laura Dague, Unwinding of Medicaid enrollment and increased uninsured emergency department visits in California, Health Affairs Scholar, Volume 4, Issue 1, January 2026, qxaf238, https://doi.org/10.1093/haschl/qxaf238↩︎
"Projected reduction in Medi-Cal coverage due to federal H.R.1 and 2025-26 State Budget, by county, 2028." UC Berkeley Labor Center and UCLA Center for Health Policy Research, February 18, 2026. https://laborcenter.berkeley.edu/health-care/↩︎
https://www.ahajournals.org/doi/10.1161/CIRCULATIONAHA.116.025057↩︎
Liu C, Srebotnjak T, Hsia RY. California emergency department closures are associated with increased inpatient mortality at nearby hospitals. Health Aff (Millwood). 2014 Aug;33(8):1323-9. doi: 10.1377/hlthaff.2013.1203. PMID: 25092832; PMCID: PMC4214135.↩︎
https://www.chcf.org/resource/2026/03/31/maternity-care-almanac/↩︎
https://www.marchofdimes.org/peristats/assets/s3/reports/mcd/Maternity-Care-Report-California.pdf↩︎
Rural maternal health interventions: A scoping review and implications for best practices - PMC↩︎